
Dynamic Lead Forms
Form Analytics
Track views, starts, completions, drop-offs, and conversion rates to optimize form performance
The Form Analytics page shows how visitors engage with your form: views, starts, completions, drop-offs and conversion rates.
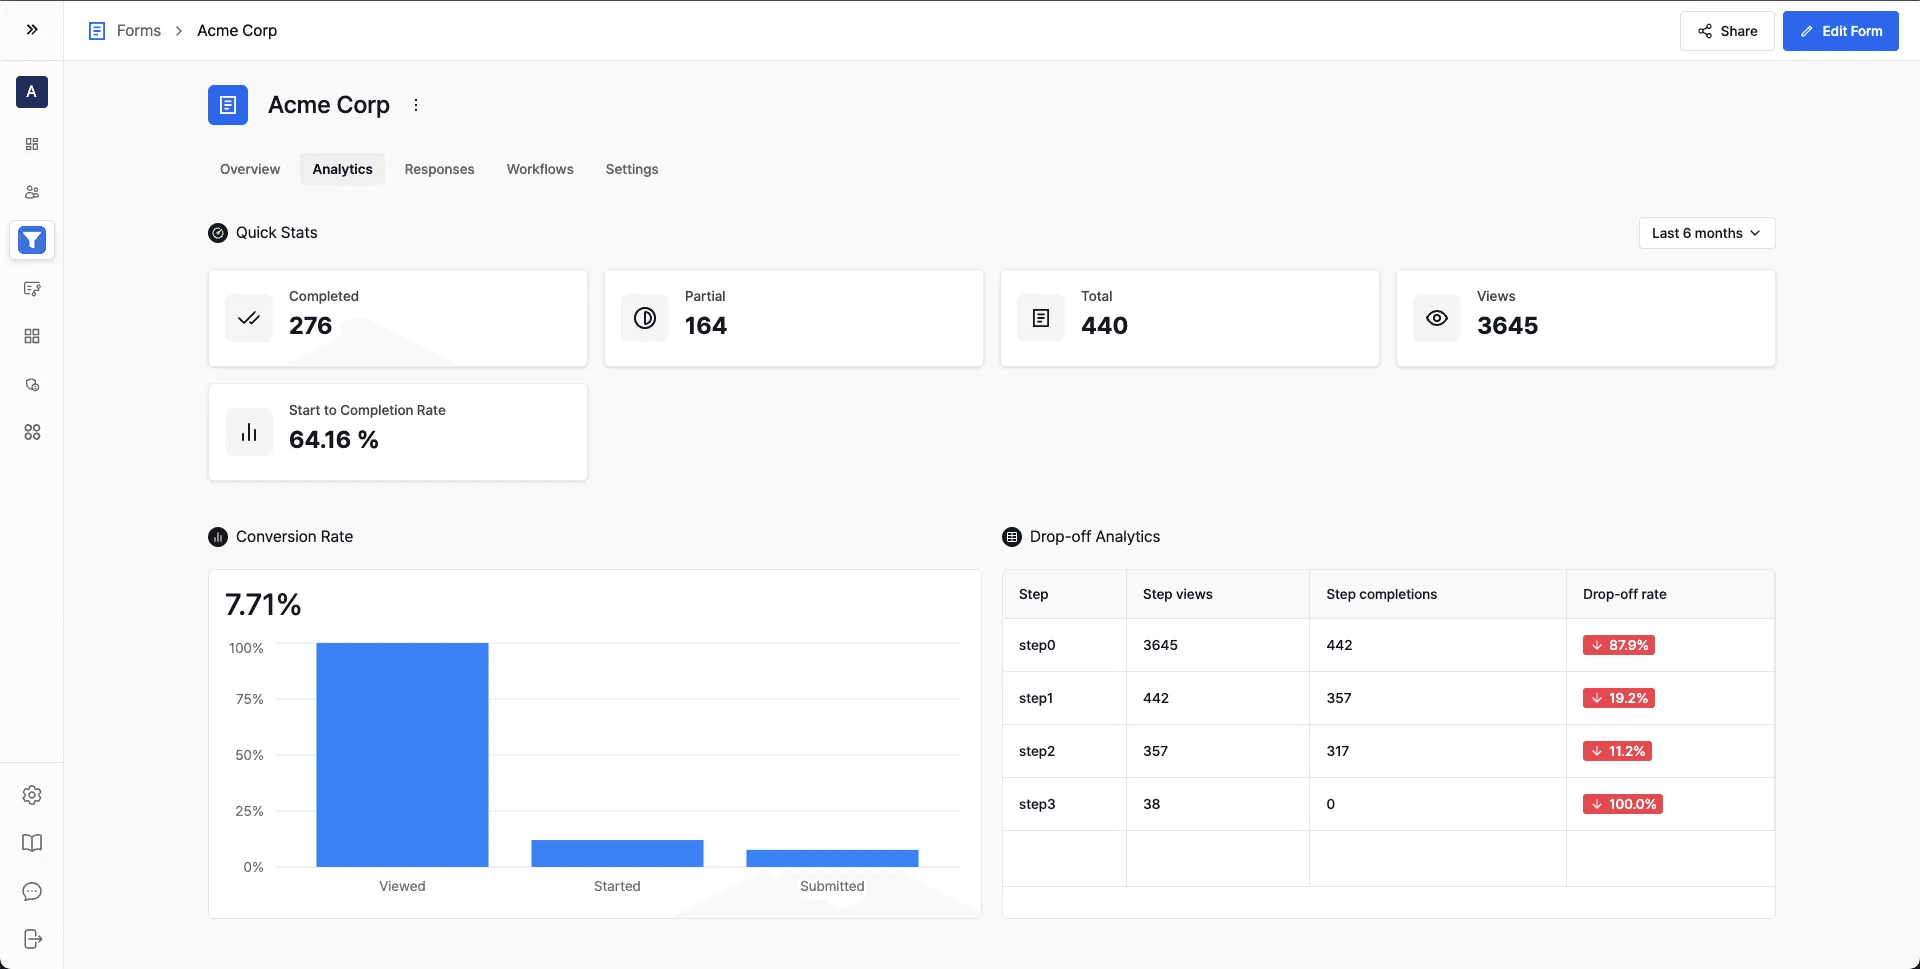
Quick Stats
At the top of the page, a snapshot of your form's performance:
- Completed → Number of users who fully submitted the form.
- Partial → Number of users who started but did not finish.
- Total → Total number of responses (Completed + Partial).
- Views → Number of times the form was viewed.
- Start to Completion Rate → Percentage of users who started the form and reached submission.
Conversion Funnel
This chart shows the percentage of users who progressed through each stage of your form funnel:
- Viewed → Visitors who loaded the form.
- Started → Visitors who began filling it out.
- Submitted → Visitors who successfully completed submission.
Drop-off Analytics
The Drop-off Analytics table breaks the funnel down step by step:
- Step Views → Number of visitors who viewed that step.
- Step Completions → Number of visitors who successfully completed that step.
- Drop-off Rate → Percentage of users who left at that step.
Fix the step with the highest drop-off rate first.